
Key Takeaways
- Contribution Analysis answers "what" drove a portfolio's total return by breaking it down by asset class or security. It is descriptive and does not require a benchmark, but producing it still depends on having reliable holdings and performance data for the period being analyzed.
- Performance Attribution answers "why" a portfolio's return differed from a benchmark by mathematically distributing benchmark-relative return differences across modeled attribution effects such as allocation and selection. It is evaluative, but it does not independently establish causality or manager skill.
- Contribution analysis can support prospect conversations and client reviews where the goal is to explain the sources of return without the complexity of benchmark comparisons, provided the firm has reliable historical performance data to calculate it.
- Performance attribution can support investment committee oversight and other benchmark-relative reviews when the analytical question is why returns differed from a stated benchmark and the required historical data infrastructure is in place.
- Choosing between the two is a question of analytical purpose and available data, not analytical superiority. Each requires different infrastructure and serves a distinct role within an advisory workflow.
Consider an illustrative quarterly portfolio review in which an advisor pulls a report showing that international equities contributed 180 basis points to the portfolio's total return. The number is accurate, but it doesn't answer the question the client is actually asking: was the decision to overweight international stocks a good one?
That is a separate question, and it calls for a different analytical framework. This illustrative scenario highlights the distinction between attribution and contribution, two concepts that sound similar but serve fundamentally different purposes in wealth management.
Contribution analysis decomposes a portfolio's total return, showing what happened. Performance attribution decomposes a portfolio's excess return relative to a benchmark, explaining how that benchmark-relative difference is distributed across modeled effects. One is descriptive; the other is evaluative.
Understanding this difference is more than an academic exercise. It shapes the clarity of client conversations, the efficiency of a firm's preparation workflows, and the quality of its investment oversight. This guide explains what each method measures, the data infrastructure each requires, and how to choose the right analysis for the right audience from prospect meetings to internal investment committee reviews.
What Contribution Analysis Measures and Where It Stops
Contribution analysis calculates each segment's or holding's impact on a portfolio's total return. It answers a straightforward question: which positions or asset classes drove the portfolio's overall result?
The calculation is typically additive. For any given segment in a simplified single-period example, its contribution can be approximated as its beginning-of-period market weight multiplied by its total return over the period. Portfolios with transactions, changing weights, or cash flows during the measurement period require more complex calculations.
Consider this illustrative example of a hypothetical multi-asset portfolio:
| Asset Class | Portfolio Weight | Return | Contribution to Total Return |
|---|---|---|---|
| U.S. Equities | 50% | 10.0% | 5.00% |
| International Equities | 20% | 5.0% | 1.00% |
| Fixed Income | 25% | 2.0% | 0.50% |
| Alternatives | 5% | -4.0% | -0.20% |
| Total Portfolio | 100% | 6.3% | 6.30% |
In this simplified case, the sum of each segment's contribution equals the total portfolio return. This makes the output often presented as a list of top and bottom contributors easy to explain.
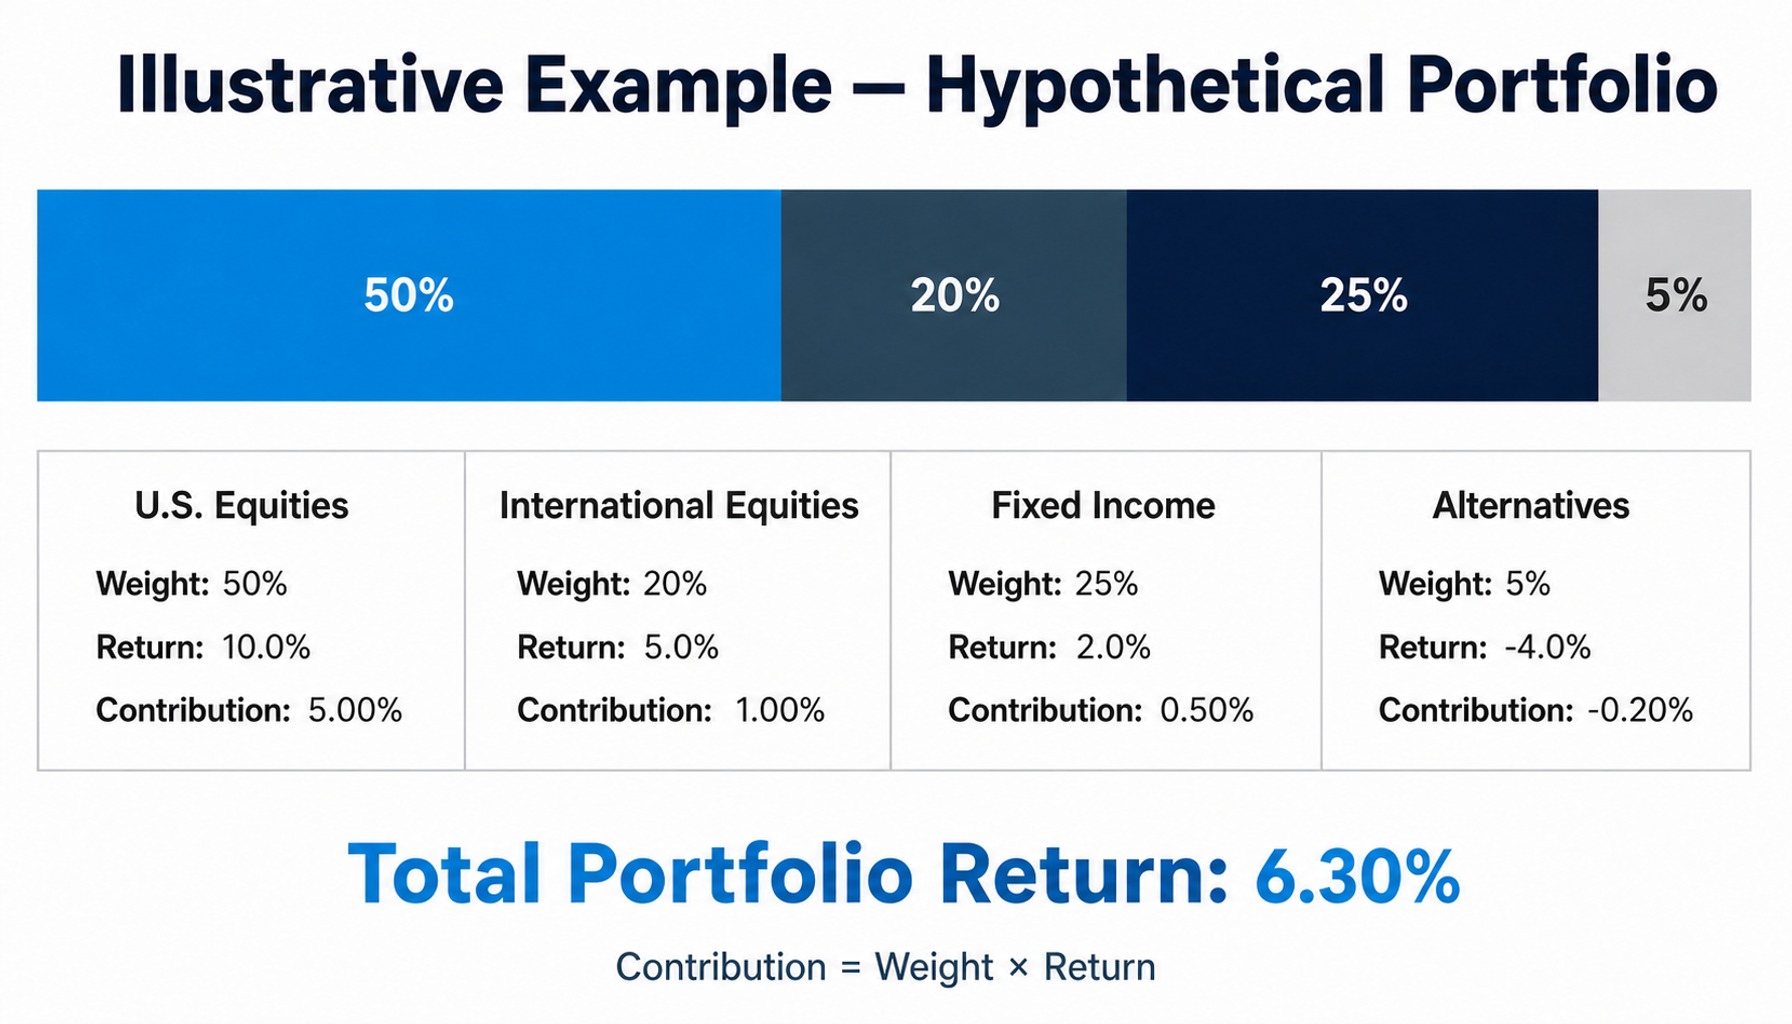
However, the simplicity that makes contribution analysis so useful is also one of its main limitations. Because it does not require a benchmark, it is silent on whether the portfolio's results were good, bad, or average. This is why contribution, on its own, offers limited support for conclusions about manager skill, even though it is sometimes used that way. Contribution is a useful descriptive tool, and evaluating results calls for a different framework.
What Performance Attribution Measures and Why It Requires a Benchmark
Performance attribution answers a fundamentally different and more complex question: not what a portfolio returned, but how its return differed from a benchmark. It is an evaluative tool designed to model the sources of excess return, decomposing that difference into modeled attribution effects associated with how the portfolio was positioned relative to the benchmark. That mathematical decomposition can be highly useful, but it does not independently establish causality or manager skill.
For investment committees reviewing active positioning against a benchmark, contribution analysis offers limited insight. Contribution cannot distinguish between return driven by deliberate positioning and return driven by simple market exposure.
Attribution's evaluation of excess return requires a benchmark, which adds explanatory depth but also creates the ongoing work of selecting and maintaining that benchmark. The analysis moves from description to benchmark-relative decomposition.
How the Brinson Framework Decomposes Excess Return
The foundational models for performance attribution, such as the Brinson-Hood-Beebower (BHB) framework (Brinson, Hood, and Beebower, "Determinants of Portfolio Performance," Financial Analysts Journal, 1986) and the Brinson-Fachler (BF) framework (Brinson and Fachler, "Measuring Non-US Equity Portfolio Performance," Journal of Portfolio Management, 1985), decompose excess return into a set of modeled attribution effects. The three primary effects are:
- Allocation Effect: Models the portion of excess return associated with weighting asset classes, sectors, or other segments differently than the benchmark.
- Selection Effect: Models the portion of excess return associated with holding different securities within those segments compared to the benchmark.
- Interaction Effect: Captures the combined, or cross-term, effect of allocation and selection differences (e.g., a segment that is overweight relative to the benchmark and also holds securities that outperformed the benchmark segment).
While the math can get complex, the concepts are distinct. Did the portfolio's excess return come from its weighting across markets (allocation), or from the securities held within those markets (selection)? The choice of model also affects how these concepts are reported: although BHB and Brinson-Fachler produce different allocation effects at the segment level, the two methods produce identical total allocation effects when segment weights sum to one hundred percent. These modeled attribution effects provide a structured framework for distributing benchmark-relative return differences across the categories the model defines.
Why Benchmark Selection Shapes Attribution Results
Benchmark choice strongly shapes how attribution results can be interpreted. An analysis run against an inappropriate benchmark can produce large, impressive-looking allocation effects that reflect benchmark mismatch rather than investment skill.
For instance, attributing a globally diversified portfolio against a purely domestic U.S. equity index would likely generate a large allocation effect across international holdings, one that would say more about the choice of index than about how the portfolio was positioned. The numbers would be mathematically correct but would not address the question the analysis was meant to answer.
Without a relevant and agreed-upon benchmark, attribution analysis offers considerably less explanatory value.
When Contribution Analysis Better Serves Client and Prospect Conversations
In many advisory workflows, especially those facing prospects and clients, the most relevant question is not about benchmark outperformance but simply about understanding what is happening inside the portfolio. In these contexts, contribution analysis is often the more appropriate tool.
A full attribution decomposition showing allocation, selection, and interaction effects relative to a hypothetical 60/40 benchmark can be more than a prospect conversation calls for. A prospect who arrives with a simple question about what is driving returns in their current portfolio may find that output technical and hard to follow, while a contribution breakdown by asset class and top holdings can address the same question with less preparation time.
Contribution analysis offers a second practical advantage: it does not require benchmark agreement. When an advisor reviews a prospect's held-away assets, the prospect may not know, use, or agree with the advisor's preferred benchmark. But producing contribution analysis still depends on having reliable historical performance data, and investment statements may not always contain enough return history on their own to support that calculation.
Furthermore, the data infrastructure requirements are different. Contribution requires holdings data plus reliable historical performance data for the period being analyzed, and that information is not always fully available from investment statements alone. Full holdings-based attribution, in contrast, may require daily data, consistent security classification, and benchmark constituent mapping, an operational effort that varies considerably from firm to firm. Portfolio structure also matters: a direct indexing account can hold hundreds of individual securities where an ETF appears as a single line, which adds to the volume of data a holdings-based analysis has to organize. For external-facing conversations, contribution is not a lesser analysis; it can be well matched to the audience and the available data.
When Attribution Analysis Is Worth the Operational Investment
Attribution tends to be most valuable when the analytical question is benchmark-relative: why did this portfolio, strategy, or composite perform differently from its stated benchmark? In those cases, contribution analysis alone is not enough, because it does not isolate benchmark-relative effects.
In this context, the benchmark is known, governed, and central to the firm's investment philosophy. The purpose of the analysis is to evaluate how benchmark-relative return differences are distributed across allocation, selection, and related modeled effects. A CIO or investment committee may use attribution outputs to review whether the firm's investment process is producing patterns that are consistent with its stated approach. The goal is not to micromanage individual accounts but to support structured review when the question being asked is relative performance versus a benchmark.
However, this capability comes at a cost. Maintaining the infrastructure for reliable, multi-period attribution including historical portfolio weights, returns, transactions, benchmark data, consistent segment classification, and linking methodologies typically requires a dedicated performance team or a specialized attribution system from providers like FactSet, Bloomberg PORT, or Morningstar Direct. For many mid-size firms, the marginal analytical value of full, daily attribution may not justify the operational investment. This is a legitimate business decision, not an analytical shortcoming. Whether attribution is run in-house or through a specialized provider, that operational choice sits alongside, rather than changes, the firm's continuing fiduciary duty to its clients.
Why Attribution Effects Sometimes Do Not Sum Correctly and What to Do About It
A common point of friction for teams new to attribution is discovering that the numbers do not reconcile neatly. Over a full year, for example, the sum of monthly allocation, selection, and interaction effects may not equal the portfolio's total excess return for the year.
This gap, often called a residual, is often a mathematical artifact of compounding returns over multiple periods, but it is not always explained by compounding alone. While a single-period attribution (e.g., for one month) often reconciles cleanly, linking those single-period results across a quarter or a year introduces a residual. This happens because returns compound geometrically, while many attribution models calculate effects arithmetically.
At the same time, reconciliation differences can also stem from calculation errors, missing data, transaction or pricing issues, or inconsistent classifications. Even when holdings classifications and pricing are accurate, the residual can still persist once returns are linked across periods, so the presence of a gap does not by itself identify the cause.
Specialized linking methods, such as the Carino linking factor or the Menchero method, have been developed to smooth or redistribute this residual over time. The choice of geometric vs. arithmetic attribution and the selection of a linking algorithm are methodological decisions with trade-offs, each affecting how results are presented. The key takeaway is that residuals in multi-period attribution are common, but reconciliation still calls for careful review of both methodology and underlying data.
Where Comparative Portfolio Analysis Fits Between Data and Conversation
Both contribution and attribution analysis depend on structured, analyzable portfolio data, but they do not depend on the same data set. Contribution analysis requires reliable holdings and performance data for the period being analyzed. Attribution typically requires a deeper historical record, including portfolio weights, returns, transactions, segment classifications, and benchmark data.
That distinction matters here. A statement-based workflow is not the same as a historical performance contribution engine or a Brinson attribution system. Once the advisor has gathered the relevant statements, the next practical step is often to analyze current holdings and compare the existing portfolio to a proposed model in a structured way. The VRGL Growth Platform is designed to help advisors work through that review process consistently, with VRGL Core serving as the foundation on which its specific capabilities are built. VRGL is not designed to provide Brinson performance attribution; its Comparative Portfolio Analysis capability is designed to help firms organize extracted portfolio data into structured comparisons of current portfolios. Firms that need attribution typically run it in a specialized system such as those described above.
In practice, VRGL combines AI-powered statement extraction with Comparative Portfolio Analysis so advisors can move from client statements to structured, client-ready comparisons across five pillars: performance, risk, diversification, taxes, and fees. This can help firms standardize the work behind advice, giving teams a consistent way to analyze and present portfolios in prospect conversations and client reviews.
See how VRGL supports your acquisition workflow from portfolio comparison to client-ready presentations.
The Right Analysis for the Right Audience
Contribution and attribution are not interchangeable. Choosing between them is not a matter of analytical sophistication but a question of audience, infrastructure, and purpose. One is not inherently better than the other; they simply answer different questions for different stakeholders.
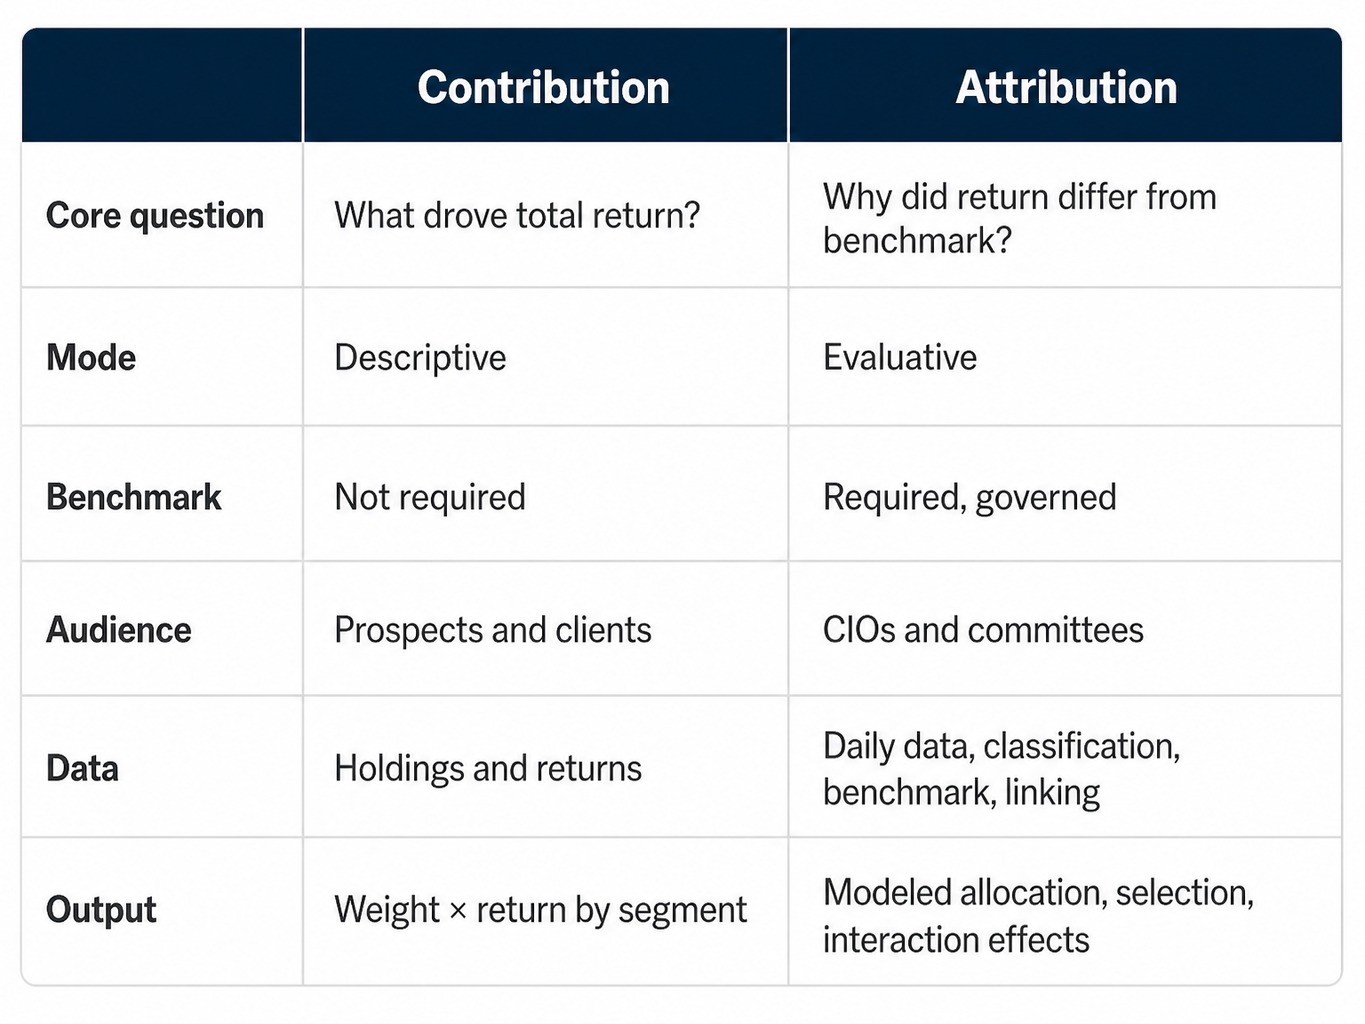
Contribution analysis tells you what happened inside a portfolio. It is descriptive, operationally simpler, and well suited to explaining the sources of total return when reliable performance data is available and a benchmark-relative question is not the point.
Attribution analysis tells you how a portfolio's results differed from a benchmark by distributing that relative return difference across modeled effects. It is evaluative, operationally demanding, and well suited to structured review when the analytical question is benchmark-relative and the required historical data is available.
Most advisory firms can benefit from using both, each applied in the context it suits. As firms grow, moving from raw portfolio data to the appropriate analysis consistently and without excessive manual work can become increasingly important, whether that analysis is a contribution breakdown prepared for a client review or attribution run in a specialized system for an investment committee.
Frequently Asked Questions
Does contribution analysis require a benchmark?
No. Contribution analysis decomposes a portfolio's total return by segment or holding using weight-times-return calculations. It does not reference a benchmark, which makes it simpler to produce but unable to evaluate whether investment decisions added value relative to an alternative.
How does holdings-based attribution differ from returns-based attribution?
Holdings-based attribution uses actual portfolio positions and weights to calculate modeled attribution effects at the security or segment level. Returns-based attribution uses only portfolio and benchmark return streams, often inferring exposures through regression. Holdings-based provides more granular insight but requires more detailed data infrastructure.
Can a firm use contribution data in prospect conversations without implying performance reporting?
Contribution data describes what happened inside a portfolio, showing which holdings or asset classes drove results, without comparing to a benchmark. Whether a particular presentation of this data raises performance-reporting considerations is a question for each firm to review with its compliance and legal professionals under its own disclosure framework.
Do allocation effects offset in aggregate under the Brinson framework?
When segment weights in both the portfolio and the benchmark sum to 100 percent, overweighting one segment necessarily means underweighting others. But the allocation effects themselves do not necessarily cancel across segments, because each segment's relative weight difference is applied to that segment's benchmark return or benchmark-relative return, depending on the model. The total allocation effect therefore reflects the net impact of weighting differences across segments, not a mechanical offset of all allocation effects to zero.
What infrastructure does a firm need to support reliable attribution analysis?
Reliable attribution typically requires consistent segment classification between the portfolio and benchmark, daily or at least monthly data, a governed benchmark selection process, and a linking methodology for multi-period analysis. Many firms use specialized platforms like FactSet, Bloomberg PORT, or Advent APX to manage this infrastructure.
Is the interaction effect in Brinson attribution a meaningful signal or a mathematical residual?
The interaction effect captures the combined impact of simultaneously overweighting a segment and selecting securities that exceed the benchmark segment's return within it. It is a mathematical cross-term within the attribution model, not a residual and not an independent demonstration of manager skill. Some firms report it separately, while others reallocate it into allocation or selection for presentation purposes, but that reporting choice should be disclosed because it changes how benchmark-relative return differences are described.
This article is provided for informational purposes only and does not constitute investment, legal, compliance, tax, or accounting advice.